By Peter McGurk, Joseph D’Aleo and George Taylor
We received an interesting analysis from Peter McGurk, a meteorologist and climatologist and member of Icecap. It began as follows: “In a NASA posting by Kendall Haven, there was a very interesting discussion entitled “Greenland’s Ice Island Alarm”. The article described how NASA is using advanced satellite technology to try and get an accurate estimate of the amount of ice loss currently occurring in the Greenland Ice Sheet. NASA noted that in terms of ice sheet elevation, most of the loss is occurring near the edges, but due to somewhat warmer temperatures snowfall has increased across interior portions of the ice sheet so that across many inland sections the ice sheet elevations are unchanged or increasing, especially across much of southern Greenland.”
Peter went on to take an in-depth look at the annual retreat rates of the Jakobshavn glacier and their relationship to the AMO (Atlantic Multidecadal Oscillation).
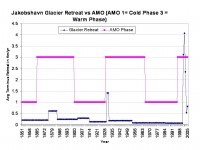
He also finds on the longer time scales interestingly that the interglacial periods seem to be getting shorter while the glacial periods longer. Peter concludes “It seems to me that climate cycles have been occurring on this planet for millions of years and will continue to do so. Latching on to little pieces of these cycles and projecting them out linearly forever is not very realistic. We are still trying to unravel the complexities of our climate system with all its wonderful checks and balances. Maybe someday we might even figure it all out, but as my late professor Dr. Theodore Fujita used to say “nothing integrates as fast as Mother Nature”. In the long run, the Earth will take care of itself and the Greenland ice sheet will be just fine.”
See Peter’s full analysis here. I have added some relevant information supporting Peter’s conclusions from an earlier blog story authored by George Taylor and I.
Science Trumped by Human NatureScientific Allliance Newsletter
We have benefited enormously from scientific advance and its practical applications. Humans are the ultimate generalists and highly adaptable because they observe and learn. The scientific method takes this one stage further: we put forward hypotheses and do experiments to validate them. If the hypothesis doesn’t fit the observations, we reject it. But if it does fit the facts, that doesn’t prove it’s right. Science should continually test theories so that we become more certain of their correctness, but we can never be absolutely sure.
Post-modern thinking teaches that there are no hard truths, that scientific “facts” are social constructs. In one sense, that’s true, since we can never provide absolute proof of any theory. But, taken to the extreme, this school of thought is essentially anti-science and leads to the dangerous tendency we see today of decisions being made on the basis of people’s feelings rather than any objective basis. That leads to belief- rather than evidence-based policy. It also leads us away from the Enlightenment.
But science also is not a perfect, foolproof system; neither is it perfectible. The scientific method, for all its advantages as a basis for decision-making, and for all the benefits it has undoubtedly brought us, is only an overlay on human nature.
Since there remain large areas of uncertainly the scientific method should mean that we continue to make observations until the evidence becomes compelling. But the majority of people now believe global warming – human induced global warming – to be an established truth. And the reason for this is typical crowd behaviour: when enough establishment scientists make their views known, have them amplified by the media and supported by the environmental movement, the majority of people take this as the truth. It’s the Emperor’s new clothes once again. Those who play the role of the little boy pointing out that the Emperor is in fact naked are derided and attacked, often in very personal ways. The establishment does not tolerate dissent well.
So, what will happen? Ultimately, the whole debate will be settled on the basis of real evidence. Whatever policy is implemented in the meantime is likely to be immaterial in terms of influencing the climate, although it will consume resources, slow growth and actually have a real negative impact on those at the bottom of the pile. But at some stage – perhaps by 2010, perhaps later – we could reach a tipping point where it becomes clear to the majority of scientists, commentators and the public that, whatever is happening to the climate, Mankind is not the major contributor, and cannot reset the thermostat by reducing carbon dioxide emissions. Alternatively, real confirmatory evidence that carbon dioxide is the main driver may be found, and those critics with open minds will change their views.
If a tipping point is reached where the current received wisdom is overturned, it’s trust in the scientific establishment which will be the loser, and that could lead to further erosion in the general public’s regard for the scientific method. Human nature would have trumped science, and science would suffer.
Read more here or got the see the newsletter at the Scientific Alliance website here.
By Steve McIntyre, Climate Audit Blog
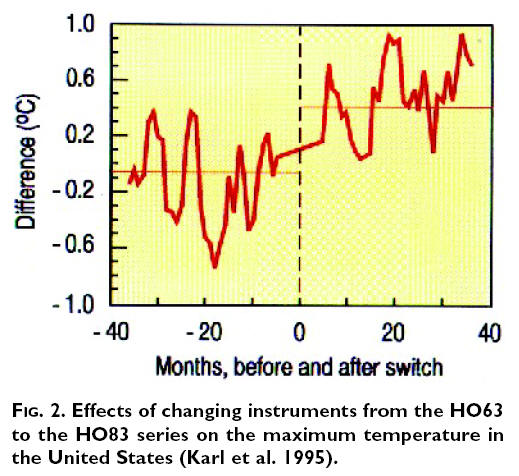
In the discussion of the Tucson weather station, Ben Herman of the U of Arizona observed that there were serious biases with the HO83 hygrothermometer - introduced in the early 1990s - which was said to be a contributor to the uptick to Tucson values. Although USHCN has implemented adjustments to U.S. data to deal with time-of-observation bias and station history, both of which resulted in significant upward adjustments of recent data relative to earlier data, I have been unable to see any evidence that either NOAA or NASA made any attempt to adjust for the upward bias of recent readings using the HO-83 thermometer, although its problems are thoroughly discussed in the specialist literature.
So problems with the HO83 thermometer are amply documented in specialist literature. USHCN has been quick to adjust time-of-observation bias which worked in the direction of increasing 20th century trends - what have they done to adjust for HO83 bias which caused an upward bias to measurements in the 1990s?
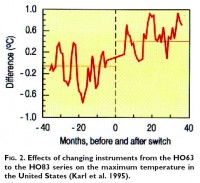
I must confess that this indicates at least the possibility of a bias in adjustment decisions: one is hard-pressed not to take away an impression that, if the HO83 adjustment had increased 20th century trends, that Karl and Hansen would have been on it like a dog on a bone, but, since the adjustment will lower late 20th century temperatures, the adjustment mysteriously becomes too elusive to implement. Just an impression.
Read more here on Steve’s blog.
By Dr William Gray
It is now over a year-and-a-half since the media explosion following hurricanes Katrina and Rita’s landfalls and several papers saying that the US landfalling hurricanes of 2004-2005 probably had a human-induced global warming component. With this there was an implication that US hurricane landfall and damage would continue to get worse with time as CO2 amounts continued to rise.
Although global mean CO2 and Atlantic surface temperatures have increased between the two 50-year periods (1900-1949 compared with 1956-2005), the frequency of US landfall numbers actually shows a slight downward trend for the later period. It is also to be noted that there were 39 US landfalling major hurricanes (Cat 3-4-5) between 1925-1965 and only 22 in the same length period between 1966-2006 when CO2 amounts were getting higher.
The increased Atlantic hurricane activity since 1995 is a result of a speed-up of the Atlantic thermohaline circulation – as occurred also in the 1940s-1950s and the late 19th century. The advocates of CO2 are either unaware or unaccepting of this plausible explanation. The alarmist’s position that the overall trend in SSTs and tropical cyclone and hurricane numbers is substantially influenced by greenhouse warming. Read Bill’s take on the season and the issue here.
By Sherwood, Keith and Craig Idso, CO2 Science
In an intriguing Climate Change report in Science, Wentz et al. (2007) note that the Coupled Model Intercomparison Project, as well as various climate modeling analyses, predict an increase in precipitation on the order of 1 to 3% per °C of surface global warming. Hence, they decided to see what has happened in the real world in this regard over the last 19 years (1987-2006) of supposedly unprecedented global warming, when data from the Global Historical Climatology Network and satellite measurements of the lower troposphere have indicated a global temperature rise on the order of 0.20°C per decade.
Using satellite observations obtained from the Special Sensor Microwave Imager (SSM/I), the four Remote Sensing Systems scientists derived precipitation trends for the world’s oceans over this period; and using data obtained from the Global Precipitation Climatology Project that were acquired from both satellite and rain gauge measurements, they derived precipitation trends for the earth’s continents. Appropriately combining the results of these two endeavors, they then derived a real-world increase in precipitation on the order of 7% per °C of surface global warming, which is somewhere between 2.3 and 7 times larger than what is predicted by state-of-the-art climate models.
Based on theoretical considerations, Wentz et al. concluded that the only way to bring the two results into harmony with each other was for there to have been a 19-year decline in global wind speeds. But when looking at the past 19 years of SSM/I wind retrievals, they found just the opposite, i.e., an increase in global wind speeds.
In discussing these embarrassing results, Wentz et al. correctly state that “the reason for the discrepancy between the observational data and the GCMs is not clear.” They also rightly state that this dramatic difference between the real world of nature and the virtual world of climate modeling “has enormous impact,” concluding that the questions raised by the discrepancy “are far from being settled.” We agree. And until these “enormous impact questions” are settled, we wonder how anyone could conceivably think of acting upon the global energy policy prescriptions of the likes of Al Gore and James Hansen, who speak and write as if there was little more to do in the realm of climate-change prediction than a bit of fine-tuning. Read more here.
Guest blog by Dr. Anthony Lupo, University of Missouri
A recent paper published in the Geophysical Research Letters deserves some attention, not only for the work done, but the implications of the paper as well. The paper, “A new dynamical mechanism for major climate shifts”, by A.A. Tsonis, K. Swanson, and S. Kravtsov is remarkable because it brings back some common sense in the climate change debate. This paper discusses the collective behavior of four major climate “cycles” or variations and how they may interact with each other to impact the overall direction of climate or climate change. Some of these cycles are well-known to the public, such as El Nino or the North Atlantic Oscillation, and others are less known such as the Pacific Decadal Oscillation.
The authors can account for the warming and cooling periods of the 20th century by examining the dynamic behavior of these climate variations. In particular, they find that the climate regime can shift when these four cycles “synchronize”. Thus, they find that climate can shift, or change, due to internal (non-linear) climate dynamics, and they don’t even have to invoke an external climate change mechanism such as solar forcing. This is new and exciting work.
Thus, the paper cited above is a welcome message and is message that, while not exactly new, must be repeated over and over again even if the message is presented in different ways. Others, including many climate experts on this website have delivered a similar message. For example, a document authored by J. D’Aleo and G. Taylor present observed global temperature trends and demonstrate the same type climatic behavior that Tsonis et al. (2007) show can now be modeled.
Additionally, other studies including some published by my own research group demonstrates that changes in the frequency and intensity of natural cycles (such El Nino) can be modulated by other natural cycles (such as the Pacific Decadal Oscillation) and that the impact on the variations in local climates can be profound. Read more here.
By Roy Spencer on Roger Pielke Sr’s Climate Science Weblog
There are three main points/opinions/issues I’d like to explore, which are all interrelated:
(1) The traditional way in which feedbacks have been diagnosed from observational data has very likely misled us about the existence of positive feedbacks in the climate system.
(2) Our new analyses of satellite observations of intraseasonal oscillations suggest negative cloud feedbacks, supporting Lindzen’s Infrared Iris hypothesis.
(3) I am increasingly convinced that understanding precipitation systems is the key to understanding climate sensitivity.
I think it is time to provoke some serious discussion and reconsideration regarding what we think we know about feedbacks in the real climate system, and therefore about climate sensitivity. See this thought provoking analysis here.
By Joseph D’Aleo, Icecap
Carbon dioxide is 0.00038 or 0.038% of our atmosphere by volume. Only 2.75% of atmospheric CO2 is anthropogenic in origin. The amount we emit is said to be up from 1% a decade ago. Despite that increase, our annual contribution each year is just 0.00001 or 0.001% of our atmosphere by volume. Despite the increase in emissions, the rate of change of atmospheric carbon dioxide at Mauna Loa remains the same as the long term average (+0.45%/year). This is likely because the oceans are a far more important sink for excess carbon dioxide than generally accepted. If the atmosphere was a 100 story building, our anthropogenic CO2 contribution today would be equivalent to the linoleum on the first floor. By comparison, water vapor, a far more potent greenhouse gas, on average would occupy on average 1 floor and at times, especially in the tropics, up to 4 floors.
See in this brief paper, how the changes year-to-year relate to ENSO and volcanic eruptions rather dramatically which suggests the carbon dioixde in the atmosphere reacts rapidly to changes in the oceans and as Segalstad and others have speculated likely has a far shorter residence time in our atmosphere (5-7 years) than claimed by the IPCC (150-200 years). This could have a significant effect on the ability of climate models to forecast future levels of carbon dioxide and temperatures.
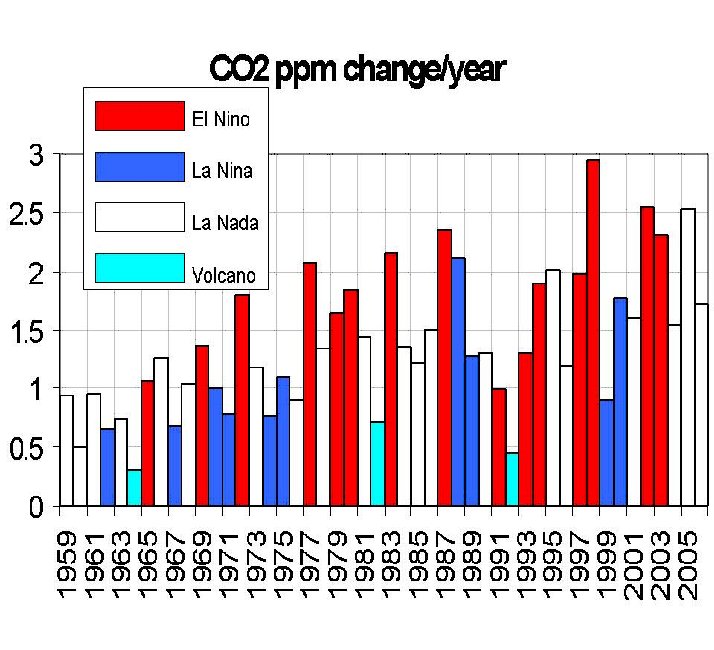
Notice a pattern? The annual rates of increase in carbon dioxide El Ninos tend to be more, La Nina less, volcanic years least.
For El Ninos the average increase has been 1.80ppm/year, La Ninas over 40% less at 1.03. For years after major volcanic eruptions (Agung, Mt St Helens, El Chichon, Pinatubo, Cerro Hudson) the average increase is just 0.61 ppm. For ENSO (eliminating major volcano years), the Pearson correlation is a moderately strong 0.67 with the CO2 changes.
The reason the rate increases during El Ninos is that El Ninos cause global land and sea temperatures to rise. As oceans warm, they release more of the stored carbon dioxide. The CO2 rate of increase diminishes after La Ninas and volcanic eruptions as land and sea cool. As the oceans cool, they take in more carbon dioxide.
This rapid response supports the notion of a shorter lifetime for CO2 (5 to 7 years) as suggested by Segalstad and 35 other studies he compiled, far short of the 150-200 years the IPCC claims. If this more rapid atmospheric response and shorter residence times are correct, it is another flaw in the global climate models that may exaggerate the changes upcoming.
New Model Supports Our Theory the Oceans May Be the Real KeyBy Joseph D’Aleo, Icecap
In an earlier blog and paper, George Taylor and I made a case for the multidecadal cycles in the ocean temperature patterns controlling tempeerature cycles over at least the United States, Greenland and the arctic.
Michael Asher in the Daily tech reports that a team of mathematicians have come forth with model that supports this theory. Led by Dr. Anastasios Tsonis, their model says the known cycles of the Earth’s oceans—the Pacific Decadal Oscillation, the North Atlantic Oscillation, El Nino (Southern Oscillation) and the North Pacific Oscillation—all tend to try to synchronize with each other. We had earlier reported on this paper in What’s New and Cool as covered by Science Daily but we fell it is worth reiterating.
The theory is based on a branch of mathematics known as Sychronized Chaos. The math predicts the degree of coupling to increase over time, causing the solution to “bifurcate,” or split. Then, the synchronization vanishes. The result is a climate shift. Eventually the cycles begin to sync up again, causing a repeating pattern of warming and cooling, along with sudden changes in the frequency and strength of El Nino events. They show how this has explained the major shifts that have occurred including 1913, 1942 and 1978, just as our analysis showed.
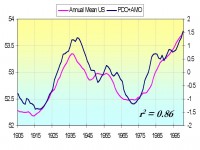
PDO+AMO vs US Annual Mean Temps (Icecap)
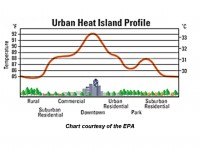
The IPCC and NCDC with their GHCN and NASA with their GISS data bases admit the importance of urban warming locally but suggest the effect of urbanization on the global data bases is small and can be neglected. This judgment is largely based on the comments in a paper in 2003 by Petersen that stated: “Contrary to generally accepted wisdom, no statistically significant impact of urbanization could be found in annual temperatures.” This same argument is being used to discard the urban heat island adjustment of the original USHCN data set when the new version 2 is released shortly.
In recent blogs by Stephen McIntyre, Steve discusses Petersen’s paper, his analysis and errors in the analysis and conclusion. Another paper surfaced this week in the Journal of Geophysical Research-Atmospheres by Della-Marta et al., in which the authors blatantly admitted to cherry picking stations and adjusting data (downward) in the early warm part of the record allegedly because of changes in instrumentation. They said this suggested a more alarming warming of 1.6C instead of 1.3C since 1880 in Europe.
See why in this blog and the links provided why both Petersen and Della Marta have it all wrong and why it is the rural areas that become towns, small towns that become bigger towns, towns that become cites where the warming seen is the greatest. Those locations are what cause the global unadjusted data sets to show the warming they do. That is not to exclude the natural ups and downs due to the natural variability which is superimposed on this urban induced rise.
Read the full blog and see the many links in WORD here. or for PDF here.
By Joseph D’Aleo, Icecap
With the changes to the GISS data made today after an error was found by Stephen McIntyre, 1998 falls to #2 behind 1934 as the warmest year, followed by 1998, 1921, 2006, 1931, 1999 and 1953. Expect more changes to come in the months ahead as more scrutiny of the data bases takes place. Note in the graph below, the peak in the five year mean around 2000 is a mere 0.25F higher than that in the early 1930s.
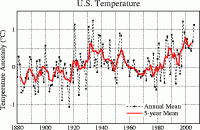
10 of the top 20 warmest years occcurred since 1980, 10 from the 1920s to 1950s. Only 4 of the top 10 occurred since the 1980s, 6 fell in the prior warm period. See details of the new rankings here.
Don’t expect any press releases from NASA or NOAA about this change nor much coverage on the networks or major newspapers.
By Joseph D’Aleo, Icecap
Our national centers regard station data as critical to measure recent climate change. The raw observations are taken from the stations then adjusted to account for local factors like site changes, changes in instrumentation, time of observation and in some cases urbanization (Karl 1988). One would think the differences would be small and that once adjusted, the data would stand the test of time.
We found that to be far from the truth by examining the data sets for our biggest city, New York City and the climate station in Central Park. We have looked at this in two separate blogs. I have combined the two and added to it in this analysis.

Central Park, New York City Observing Site at Belvedere castle
I find the data mind boggling. For our own government to maintain three different versions of historical data for a single site whose average July temperature for much of the record varies by 11F! and where the adjustments to the data decrease in recent years introducing a warming not in the raw data. These kinds of variances and ‘adjustments” in the “data” have got to have you question whether we can trust any surface station based data set to determine changes the order of a tenth of a degree for climate change assessment.
See the updated analysis here.
By Joseph D’Aleo, ICECAP
Just recently, with the release in the Proceedings of the Royal Society of the paper “Recent Oppositely Directed Trends In Solar Climate Forcings And The Global Mean Surface Air Temperature” by Mike Lockwood and Claus Frohlich, the global warmers declared victory and went home.
In their abstract, the authors noted “There is considerable evidence for solar influence on the Earth’s pre-industrial climate and the Sun may well have been a factor in post-industrial climate change in the first half of the last century. Here we show that over the past 20 years, all the trends in the Sun that could have had an influence on the Earth’s climate have been in the opposite direction to that required to explain the observed rise in global mean temperatures.”
Read in this review with comments from Richard Willson, Columbia University and Chief Investigator for the NASA ACRIMSAT project and Dr. Nicola Scafetta of Duke University, co-author of a landmark paper that used a phenomenological approach to study the solar impact on 400 years of a global surface temperature record since 1600 where Lockwood and Frolich went wrong and why the sun is very likely still the leading candidate for climate change responsibility. Lockwood_and_Frolich_Review.pdf
BY Alexandre Aguiar / MetSul
One of the most important cold spells to affect Southern Brazil in recent times brought record low temperatures, widespread and severe frost as well as snow to the region. On Thursday (July 12th), the state of Rio Grande do Sul was whitened by frost. The freezing temperature was associated to the same air mass that prompted the first snowfall to the city of Buenos Aires (Argentina) in 89 years. Temperature in the city of Bage, state of Rio Grande do Sul, fell to minus 3.8 degrees Celsius, the lowest since 1955. Nearby, inside Uruguay, the national low in Mercedes was minus 6.6 degrees. At least three Uruguayans died in consequence of the cold temperatures. On Wednesday (July 11th), Porto Alegre, the state capital of Brazil’s southernmost state of Rio Grande do Sul, recorded one of its lowest ever record daily highs with clear skies. The high only reached 9 degrees C. In the following morning, the city awakened with frost inside the urban heat island, a rare fact not observed since July 14th 2000. The low temperature of 0.3 degree was the lowest since July 14th 2000.
All over the state the temperature dropped to the freezing level, even in the coastal areas. In the city of Pelotas, frost was observed in the sands of Laranjal Beach in the Patos Lake. One day after the snow in Buenos Aires, Argentina, snow was also recorded in three cities of the State of Rio Grande do Sul: Soledade, Arvorezinha and Itapuca. The snow fell for about one hour and was heavy at some times. Residents from the hills in the state of Parana, closer to Central Brazil, reported to local meteorologists a brief snowfall. If confirmed, it would be the first snow to be recorded in the region since 1999. Temperature monthly anomalies are below average in the state of Rio Grande do Sul since May in the coldest climatic winter in recent memory.
See story with photoes on METSUL’s website here.
By Joseph D’Aleo, Icecap for the Energy Tribune
With the prospects of climate change legislation that could cost American families up to $4,500/year by 2015 by some estimates or talk of using known technology to sequester carbon through well drilling, which Michel Economides (in Energy Tribune 2007) has estimated could cost up to $7.2 trillion or 60 times the current costs of drilling, the need to be certain we really have a problem becomes even more critical. I was asked by Michael to address the climate change issue to determine whether the earth was truly warming out of control, whether carbon dioxide was really to blame and if not what other factors might be important.
In this guest editorial for Energy Tribune, I addressed the issues of climate change and the possible causes. I talked about the problems with the earth’s surface data that is being ignored, made the case that greenhouse gases get a bum rap for what is really natural cyclical changes induced by cycles in the sun and oceans. I show how these cycles suggest cold and not warm was in our future. Before the next assessment, the world may be taking note of the cooling or the cessation of the warming.
Lost in all of this is the fact that we have been in a climate optimum the last 30 years with warmer temperatures, more rainfall, and increased CO2 that has enabled us to grow more food more places and consume less energy than we would have had the cold weather of the 1960s and 1970s persisted. Descending back into a little ice age has far greater negative consequences than a slow and relative minor warming. Crop failures and famines are more common due to dryness and cold and the world would consume more energy for heating. We may look back at the late 20th century and the early 21st century as the golden years.
Future generations will shake their heads at how we didn’t recognize a good thing when we had it and how science was hijacked by politics, environmentalism and greed. We would be better off spending all our dollars and efforts on maximizing energy sources, new and old than trying to eliminate a gas that does far more good than harm.
See the full story here.


